【Hong Kong, April 8, 2024】 – GUM has released the Q1 2024 MPF performance today. “GUM MPF Composite Index” rose by 2.5%, and the average member earnings for the year amounted to HKD 6,022. The “GUM MPF Equity Index” increased by 3.2%. The “GUM MPF Mixed Asset Index” recorded a gain of 2.8%. On the other hand, the “GUM MPF Fixed Income Fund Index” saw a modest increase of 0.3%.
Review and Outlook
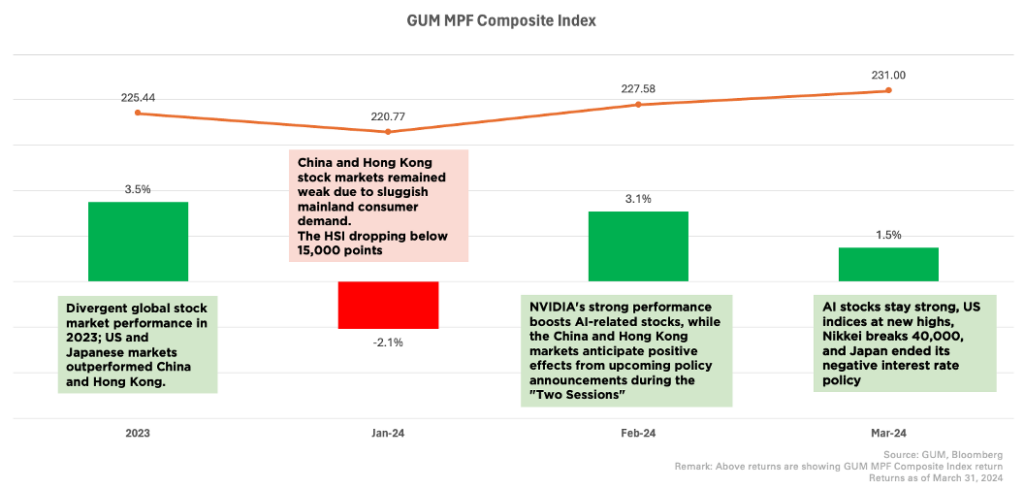
The 2024 Q1 continues the trend of 2023, with strong performance in the European, US, and Japanese markets. The US stock market reached new highs driven by technology stocks, and the FED announced a delay in interest rate cuts. The Bank of Japan ends its 17-year negative interest rate policy, and the Japanese stock index breaks through the key level of 40,000 points. The China and Hong Kong markets experienced a decline in January, but rebounded in February due to market expectations surrounding the “Two Sessions”.
As of February, approximately HKD 7 billion flowed into “US Equity Fund” and “Default Investment Strategy Fund”, with the majority of these funds being transferred from “Hong Kong Equity Fund”, “Greater China Equity Fund”, and “Mixed Asset (80% to 100% Equity) Fund”.
MPFA announced that the overall development and testing of the eMPF platform have been completed during the Legislative Council’s Financial Affairs. YF Life and China Life will be the first trustees to join the platform in June-July this year. Other trustees are planning to complete their migration to the platform by the end of next year. This marks an important milestone in the MPF market.
Regarding the outlook for 2024 Q2, GUM’s Managing Director, Michael Chan, pointed out “Currently, fund returns are diverging, with better performance observed in global markets. High-risk investors may consider investing in US and Japanese equity funds. Low-risk investors can opt for MPF Conservative funds to earn stable returns. Medium-risk investors can allocate their investments to DIS funds, which offer a wider geographical distribution and lower management fees.”
Table 1: Overall performance of MPF and average Gain/Loss per member
| Index | Value | 2024 YTD Return (%) | March Return (%) |
| GUM MPF Composite Index | 231.0 | 2.5% | 1.5% |
| GUM MPF Equity Fund Index | 303.1 | 3.2% | 1.9% |
| GUM MPF Mixed Asset Fund Index | 236.6 | 2.8% | 1.8% |
| GUM MPF Fixed Income Fund Index | 126.0 | 0.3% | 0.3% |
| Average MPF Gain/Loss Per Member Note 1 (HK$) | +6,022 | +3,670 | |
Chart 1: Return Analysis for 2023-2024
Analysis of Equity Fund Performance
In Q1, the MPF market has been influenced by the strong performance of global markets. The overall return for equity funds reached 3.2%. Specifically, the YTD returns for Japanese and US equity funds were 12.3% and 9.8% respectively. Except for Hong Kong and Greater China, other equity funds have generated positive returns.
China’s “Two Sessions” confirmed a 5% economic growth target and proposed plans for industrial upgrades in sectors such as technology, biotechnology, new energy vehicles, and electronics. However, the effectiveness of these plans will require further observation over time.
Table 2: Ranking of Equity Fund Performance (Sorted by2024 YTD Return)
| Ranking | Equity Sub-category Fund Index | 2024 YTD Return (%) | March Return (%) |
| 1 | Japanese Equity Fund | 12.3% | 3.6% |
| 2 | United States Equity Fund | 9.8% | 2.9% |
| 3 | Global Equity Fund | 7.7% | 3.0% |
| 4 | Other Equity Fund | 7.6% | 2.0% |
| 5 | European Equity Fund | 5.7% | 3.4% |
| 6 | Asian Equity Fund | 3.7% | 2.7% |
| 7 | Greater China Equity Fund | -0.3% | 1.5% |
| 8 | Hong Kong Equity Fund | -3.2% | 0.2% |
| 9 | Hong Kong Equity (Index Tracking) Fund | -3.6% | 0.2% |
Analysis of Mixed Assets Fund performance
The “DIS Core Accumulation Fund” and the “Mixed Asset- (>80-100% Equity) Fund” have experienced the highest gains YTD, rising by 4.7% and 3.6% respectively. This can be attributed to these funds having a higher allocation to equity markets and benefiting from the overall rise in global equity markets. Other mixed asset funds have also recorded positive returns.
Table 3: Ranking of Mixed Assets Fund Performance (Sorted by2024 YTD Return)
| Ranking | Mixed Asset Sub-category Fund Index | 2024 YTD Return (%) | March Return (%) |
| 1 | DIS Core Accumulation Fund | 4.7% | 2.1% |
| 2 | Mixed Asset- (>80-100% Equity) Fund | 3.6% | 2.1% |
| 3 | Target-Date Fund | 3.1% | 2.1% |
| 4 | Mixed Asset- (>60-80% Equity) Fund | 2.6% | 1.7% |
| 5 | Mixed Asset- (>40-60% Equity) Fund | 1.5% | 1.5% |
| 6 | DIS Age 65 Plus Fund | 1.0% | 1.1% |
| 7 | Dynamic Allocation Fund | 1.0% | 1.2% |
| 8 | Mixed Asset- (>20-40% Equity) Fund | 0.3% | 1.1% |
| 9 | Other Mixed Asset Fund | 0.3% | 1.0% |
Analysis of Fixed Income Fund Performance
The slight rebound in US inflation data has led the Federal Reserve to postpone interest rate cuts. The higher interest rates have put pressure on bond prices, and it is expected that rate cuts will be implemented in the second half of the year. The Federal Reserve’s dot plot for March indicated an increase in the median expected rates for 2025 and 2026 to 3.9% and 3.1% respectively.
In the March Super Central Bank Week, Japan and Taiwan announced interest rate hikes, while Switzerland preemptively announced rate cuts. Central banks in Australia, the UK, and Europe have maintained their interest rates unchanged.
Table 4: Ranking of Fixed Income Fund Performance (Sorted by2024 YTD Return)
| Ranking | Fixed Income Sub-category Fund Index | 2024 YTD Return (%) | March Return (%) |
| 1 | MPF Conservative Fund | 1.0% | 0.3% |
| 2 | HKD Money Market Fund | 0.8% | 0.3% |
| 3 | Guaranteed Fund | 0.1% | 0.3% |
| 4 | RMB Bond Fund | -0.1% | -0.2% |
| 5 | Asian Bond Fund | -0.1% | 0.6% |
| 6 | RMB & HKD Money Market Fund | -0.4% | -0.3% |
| 7 | Hong Kong Dollar Bond Fund | -0.6% | 0.5% |
| 8 | Global Bond Fund | -1.8% | 0.6% |
Top 10 Best and Worst Performing Funds
Japanese, US, and global equity funds have shown impressive performance, with the top 10 best-performing funds belonging to these categories. The top 10 worst-performing funds are all Hong Kong and Greater China equity funds.
Table 5: Top 10 Best Performing Funds in 2024
| Fund Name | 2024 YTD Return (%) | AUM (Million HKD) |
| BEA (MPF) Master Trust Scheme – BEA (MPF) Japan Equity Fund | 14.8% | 153.8 |
| Haitong MPF Retirement Fund – Haitong Global Diversification Fund – Class A | 14.5% | 134.6 |
| BOC-Prudential Easy-Choice Mandatory Provident Fund Scheme – BOC-Prudential Japan Equity Fund | 12.6% | 1156.8 |
| Manulife Global Select (MPF) Scheme – Manulife MPF Japan Equity Fund | 12.2% | 5995.3 |
| Principal MPF Scheme Series 800 – Principal International Equity Fund – Class I | 10.9% | 2481.0 |
| Principal MPF Scheme Series 800 – Principal US Equity Fund – Class I | 10.5% | 5061.8 |
| AIA MPF Prime Value Choice – North American Equity Fund | 10.5% | 8587.3 |
| BEA (MPF) Value Scheme – BEA Global Equity Fund | 10.5% | 24.3 |
| Sun Life Rainbow MPF Scheme – Sun Life MPF US Equity Fund | 10.5% | 3487.5 |
| BEA (MPF) Master Trust Scheme – BEA (MPF) Global Equity Fund | 10.3% | 483.1 |
Table 6: Top 10 Worst Performing Funds in 2024
| Fund Name | 2024 YTD Return (%) | AUM (Million HKD) |
| BCOM Joyful Retirement MPF Scheme – BCOM HSI ESG Tracking (CF) Fund | -9.4% | 502.3 |
| Manulife Global Select (MPF) Scheme – Manulife MPF Hang Seng Index ESG Fund | -8.9% | 6,368.3 |
| Sun Life Rainbow MPF Scheme – Sun Life MPF Hong Kong Equity Fund – Class A | -4.3% | 29,558.2 |
| Principal MPF – Simple Plan – Principal Dynamic Hong Kong Equity Fund | -4.2% | 430.9 |
| Principal MPF – Smart Plan – Principal Dynamic Hong Kong Equity Fund | -4.1% | 841.1 |
| BCT (MPF) Pro Choice – BCT (Pro) China and Hong Kong Equity Fund | -3.8% | 6,505.1 |
| BCT (MPF) Pro Choice – BCT (Pro) Hang Seng Index Tracking Fund | -3.6% | 3,337.0 |
| My Choice Mandatory Provident Fund Scheme – My Choice Hong Kong Tracking Fund | -3.6% | 120.3 |
| BCOM Joyful Retirement MPF Scheme – BCOM Hong Kong Dynamic Equity (CF) Fund | -3.4% | 337.9 |
| Principal MPF Scheme Series 800 – Principal Hong Kong Equity Fund – Class I | -3.4% | 2,887.2 |
Analysis of Fund Switching
As of February 2024, funds have primarily been transferred from “Hong Kong Equity Fund,” “Mixed Assets (80-100% Stocks) Fund”, and “Greater China Equity Fund” to “US Equity Fund”, “DIS Core Accumulation Funds” and “Global Equity Funds”, reflecting members’ preference for funds that performed well in the previous year. Additionally, despite the rebound in the Hong Kong and China equity markets in February, funds continue to flow out, indicating that members have not regained confidence in these markets.
Table 7: Net Switching In/Out Asset Categories in 2024 YTD (Top 5)
| Asset Class | Net Switching (Million HKD) | Asset Class | Net Switching (Million HKD) |
| United States Equity Fund | HK$5,462 | Hong Kong Equity Fund | (HK$2,031) |
| DIS Core Accumulation Fund | HK$1,555 | Mixed Asset- (80-100% Equity) Fund | (HK$1,698) |
| Global Equity Fund | HK$1,168 | Greater China Equity Fund | (HK$1,423) |
| Japanese Equity Fund | HK$995 | Mixed Asset- (60-80% Equity) Fund | (HK$1,207) |
| Global Bond Fund | HK$548 | Hong Kong Equity (Index Tracking) Fund | (HK$907) |
(Data as of 29 Feb 2024)
MPF Trustees Gradually Joining the eMPF Platform from Mid-Year
The latest developments regarding the eMPF Platform were discussed during a recent panel of the Legislative Council’s Financial Affairs. It was mentioned that the overall development and testing of the platform have been completed, and two MPF trustees, YF Life Trustees Limited and China Life Trustees Limited will be the first to join the platform in June-July this year. The other three “early adopters” including Bank of Communications Trustee Limited, Standard Chartered Trustee (Hong Kong) Limited, and Bank of East Asia (Trustees) Limited (BEA (MPF) Value Scheme), are expected to complete the transition by the end of this year. The remaining trustees are planned to join the platform by the end of next year. This signifies an important milestone in the full implementation of the platform.
The platform aims to standardize, streamline, and automate the existing scheme procedures. This will relieve MPF providers from costly and complex administrative processes, creating greater cost-saving opportunities. It will also help employers and employees manage their MPF accounts more efficiently. Additionally, it is anticipated that the platform will increase the investment-focused elements, potentially attracting more experienced pension service providers to participate in the Hong Kong retirement market. MPF providers will need to make greater efforts to improve fees and investment returns to enhance their competitiveness.
GUM estimates that the first two years of implementing the platform will be challenging, and stakeholders may require some time to adapt. The MPFA recently held a platform trial session at the Legislative Council Building, inviting over 40 legislators and their assistants to be the first to experience and provide feedback. It was mentioned that multiple promotional and educational activities will be launched to assist employers and scheme members in a smooth transition to the platform. It is believed that stakeholders need not be overly concerned as the platform will contribute to long-term enhancement of retirement protection for Hong Kong citizens and increase public confidence in the MPF system.
Remarks:
- The average MPF return per member is calculated using total MPF assets of the end of February. The latest average assets per member was HK$244,182 as of 29 February 2024. The number of MPF Scheme members was 4,754,000 as of 31 Dec 2023. The GUM MPF Composite Index returns for March 2024 as of March 31, 2024.
- The growth of all fund categories indexes is calculated by asset-weighted point-to-point growth. The data for March 2024 return is summarized from 1 March to 31 March 2024.
- The End -
中文版本:
About GUM
GUM is a boutique consulting firm that provides solutions to corporate on MPF and employee benefits. We focus on people and that is why we put “U” in the very core of our brand “GUM”. Our priorities are always meeting the needs of our corporate clients and their employees, our strategic partners as well as all MPF members of Hong Kong. With our vast market experience and expert teams around actuarial, investment and employee communication, GUM leads the market to innovate, walking hand in hand with our clients to go faster and further.
Media Enquiries, please contact:
GUM
Miss Cherry Chan / Miss Karen Siu
Phone: (852) 9126-9200 / (852) 6011-5603
Email: : cherrychan@gumhk.com / karensiu@gumhk.com
Website: www.gumhk.com
This document provided the information on an “AS IS” basis. The Company undertakes no obligation to update any of the information contained in this document. Some information contained in this document contains forward-looking statements. The words “believe”, “expect” and similar expressions are also intended to identify forward-looking statements. These forward-looking statements are not historical facts. Rather, these forward-looking statements are based on the current beliefs, assumptions, expectations, estimates, and projections of our management. These forward-looking statements are not guarantees of future performance and are subject to risks, uncertainties and other factors, some of which are beyond our control and are difficult to predict. Consequently, actual results could differ materially from those expressed, implied or forecasted in these forward-looking statements. Reliance should not be placed on these forward-looking statements.